The future climate of the North Saskatchewan River Basin
In this case study, we examine simulations from a Regional Climate Model (RCM) and a hydrologic model to better understand the risk and uncertainty facing the NSRB, and to inform adaptation strategies in the face of a changing climate.
Global changes and regional responses
Climate change accelerates components of the water (hydrologic) cycle through increased evaporation. This results in an increase of the frequency and severity of flood and drought events, and a shift in the seasonal distribution of surface water supplies. Western Canada is particularly susceptible to these changes as the region has experienced an increase in temperature up to three times greater than the global average (Bonsal et al., 2019; Mudryk et al., 2018). This unprecedented rate of warming has decreased the flow of rivers draining the eastern slopes of the Canadian Rocky Mountains in recent decades (St. Jacques et al., 2010), affecting regional ecosystems, habitat and industry. Over the same period, there has been growing demand for this water to support industry in Alberta. The province has a population of approximately 4.3 million, and is home to Canada’s oil and gas industry and the majority of irrigated agricultural land.
Due to the rapid change in climate and limited record (up to 120 years) of data from weather stations and stream gauges in the North Saskatchewan River Basin (NSRB), the use of historical climate and hydrologic data to guide local planning and policy is fraught with uncertainty. Fortunately, climate and hydrologic models alleviate some of this uncertainty through the projection of future climate and water states.
The North Saskatchewan River Basin
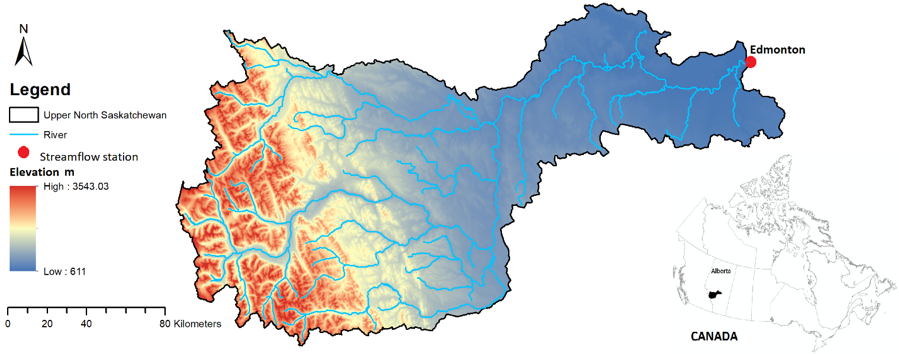
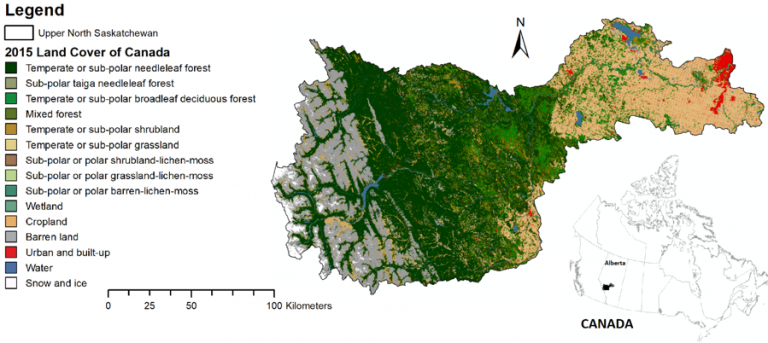
The NSRB has a drainage area of 28,100 km2 and elevations ranging between 611 (Edmonton) and 3,543 m (Rocky Mountains) above sea level (Figure 1), and a variety of land cover uses (Figure 2). Average annual precipitation across the drainage area is 619.5 mm (1979-2016), but varies from 475 mm at Edmonton to more than 1,000 mm in the Rocky Mountain ranges. The average 1979-2016 minimum and maximum temperatures over this region are -12.3o C and 13.6o C, respectively, but also varies significantly between the mountains and the plains.
Designated a Canadian Heritage River, the mean annual discharge of the North Saskatchewan River (NSR) at Edmonton (red dot in Figure 1) is 215 m3/sec. The origin of the NSR is the Saskatchewan Glacier in the Columbia Icefields. The glaciers of the Columbia Icefield experienced dramatic changes from 1919 to 2009, losing 22.5% of their total area while retreating more than 1.1 km on average (Tennant and Menounos, 2013).
Applying Regional Climate Models
Future (and past) climate from 1980 – 2080 for the NSRB was projected using the Canadian Regional Climate Model version 4 (CanRCM4) under the RCP8.5 scenario (high emissions) under a number of different initial condition simulations (Scinocca et al., 2016). The hydrology of the NSRB was simulated for the period 1951 – 2100 using the Modélisation Environmentale-Surface et Hydrologie (MESH) modelling system, which was developed by Environment and Climate Change Canada (Pietroniro et al., 2007). Modelled projections and simulations were compared with measured conditions from stream gauges and available climate data to determine natural variability in the climate and stream flow, and for calibration and validation purposes.
For full details on the methodology applied in this study, including links to supporting materials, we encourage you to download the technical summary report available below in the Further Reading section.
Lower lows and higher highs
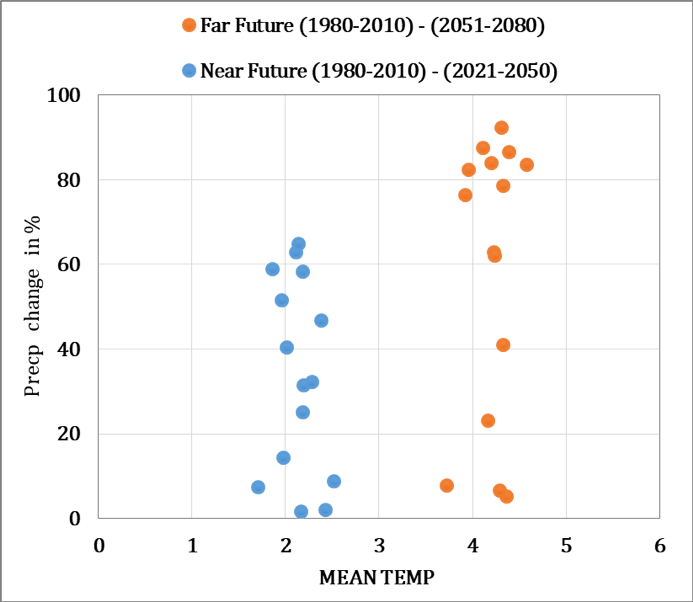
Average annual and seasonal differences in temperature and precipitation between a baseline period (1980 – 2010) and two forecast periods: a) 2021 – 2050, and b) 2051 – 2080 were computed from the CanRCM4 climate model. Figure 3 shows a rise in average annual temperature of around 2° C in the near future and approximately 4° C in the far future. The variability in precipitation shown on the y-axis is higher in the far future.
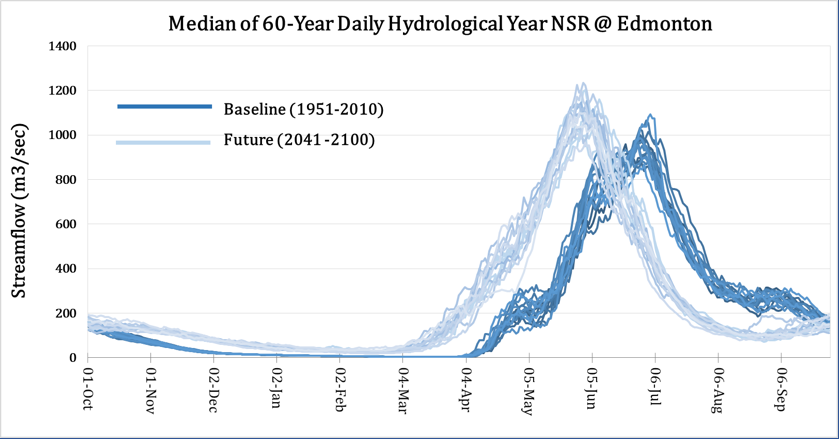
Figure 4 is a plot of the annual water-year (October – September) hydrograph for the baseline (1951 – 2010) and future (2041 – 2100) periods derived from the MESH hydrological model. It shows a clear shift in annual peak flows occurring approximately one-month earlier in the year, with higher winter flows and lower summer flows. A minor peak in late April – early May in the historical hydrograph is not apparent in the future flows. This suggests that at lower elevations, the landscape no longer contributes significant runoff in a warmer climate. A shoulder of sustained flow in September in the historical hydrograph also disappears, as future river flow steeply declines in summer and remain low as snow and glacier cover at high headwater elevations is much reduced.

Changes to water management recommended
Our modeling and analysis of the future climate and hydrology of the NSRB provide important implications for the availability, management and use of surface water in the Edmonton Metropolitan Region. Most of the recent climate change in this region has seen an increase in the lowest temperatures, as minimum daily winter temperatures have increased by about 6° C. Future projections from climate models suggest warmer and wetter weather in winter and spring and, on average, drier conditions in mid to late summer, placing greatest stress on surface water supplies during the season of highest demand.
Changes in the severity of extreme hydrological events, and in the seasonal distribution of water resources, will have major impacts on terrestrial and aquatic ecosystems, and on the availability of municipal and industrial water supplies (Fyfe et al., 2017; Sturm et al., 2017). Higher concentrations of turbidity, nutrients, and algae in water systems are anticipated as a result of increased precipitation. Moreover, a larger range of flows in the NSR, floods, droughts, forest fires, and higher water temperatures are expected in the region with an increasing frequency and severity.
Water allocation and the design of storage and conveyance structures are based mainly on average seasonal water levels, but otherwise water resources are managed to prevent the adverse impacts of flooding and drought. The operation, and possibly structural integrity, of infrastructure for drainage, water supply, and treatment is vulnerable to climate change. Much of the risk is due to the expectation of more intense precipitation, prolonged low water levels, and more extreme weather events. Adjustments to water policy, planning, and management will be required given the changes in climate and water supplies projected by this study.
For further reading
Acknoledgements
The research described in this case study was funded by EPCOR Utilities Ltd. and by the Natural Sciences and Engineering Research Council (NSERC) of Canada.

Citing this case study
Sauchyn, D.J., M.R. Anis, S. Basu and Y. Andreichuk (2022). The future climate of the North Saskatchewan River Basin. Prairie Adaptation Research Collaborative. https://data.parc.ca/nsrb [insert your date of access].
References
Bonsal, B.R., D.L. Peters, F. Seglenieks, A. Rivera, A, and A.A. Berg (2019): Changes in freshwater availability across Canada; Chapter 6 in Canada’s Changing Climate Report, (ed.) E. Bush and D.S. Lemmen; Government of Canada, Ottawa, Ontario, p. 261–342.
Canada Centre for Remote Sensing. 2015. 2015 Land Cover of Canada. Land Cover of North America Collection, no. 4e615eae-b90c-420b-adee-2ca35896caf6. Ottawa. Version updated November, 2019. https://open.canada.ca/data/en/dataset/4e615eae-b90c-420b-adee-2ca35896caf6.
Fyfe, J., C. Derksen, L. Mudryk, G. Flato, B. Santer, N. Swart, N. Molotch, X. Zhang, H. Wan V. Arora, J. Scinocca and Y. Jiao (2017). Large near-term projected snowpack loss over the western United States. Nature Communications. doi:10.1038/NCOMMS14996.
Mudryk, L.R., C. Derksen, S. Howell, F. Laliberté, C. Thackeray, R. Sospedra-Alfonso, V. Vionnet, P.J. Kushner, and R. Brown (2018). Canadian snow and sea ice: historical trends and projections, The Cryosphere, 12: 1157–1176. https://doi.org/10.5194/tc-12-1157-2018.
Pietroniro, A., V. Fortin, N. Kouwen, C. Neal, R. Turcotte, B. Davison, D. Verseghy, E.D. Soulis, R. Caldwell, N. Evora, and P. Pellerin (2007). Development of the MESH modelling system for hydrological ensemble forecasting of the Laurentian Great Lakes at the regional scale. Hydrology and Earthy System Sciences, 11: 1279–1294. https://doi.org/10.5194/hess-11-1279-2007.
Scinocca, J. F., V.V. Kharin, Y. Jiao, M.W. Qian, M. Lazare, L. Solheim, and B. Dugas (2016). Coordinated global and regional climate modelling. Journal of Climate, 29: 17–35. doi:10.1175/JCLI-D-15-0161.1.
St. Jacques, J-M., D.J. Sauchyn, and Y. Zhao (2010). Northern Rocky Mountain streamflow records: Global warming trends, human impacts or natural variability? Geophysical Research Letters, 37(6). https://doi.org/10.1029/2009GL042045.
Sturm, M., M. Goldstein, and C. Parr (2017): Water and life from snow: A trillion-dollar science question. Water Resources Research, 53: 3534-3544. doi:10.1002/2017WR020840.
Tennant, C. and B. Menounos (2013). Glacier change of the Columbia Icefield, Canadian Rocky Mountains, 1919–2009. Journal of Glaciology, 59(216): 671-686. https://doi:10.3189/2013JoG12J135.